
Stacked Decisions: Uncovering Shopper Logic with Pancake CDTs
Decoding Shopper Behavior with Pancake CDTs
11/20/20253 min read
Introduction
This is part two in my series on Consumer Decision Trees (CDTs). The first article focused on the syrup decisions shoppers make — and we started there because it’s a simpler category, with fewer decision points and clearer trade-offs. Pancake mixes, on the other hand, step things up a notch. They aren’t the most complex category in the store, but they introduce more nuance and richer shopper behavior to decode.
We’ll look at the decisions shoppers make when buying pancake mixes, identify key entry points, and unpack what the branching paths reveal. As a reminder, this analysis relies on publicly available (and admittedly limited) transaction data. It’s not perfect, but it’s amazing how much insight you can still extract. I also want to give credit to Kodiak Cakes, which has disrupted and reshaped this category. Fortunately, my dataset includes them—though I’ve spotted plenty of innovation at my local Publix that didn’t exist when this data was captured.
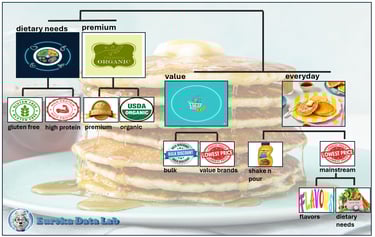
🧩 Consumer Decision Tree - Pancake Mixes
Let’s flip right into the tree (pun intended).
Here are a few observations to help you interpret the CDT and understand the shopper logic behind each branch:
Premium vs. Value/Everyday:
The first decision shoppers make is whether to enter the premium or value side of the aisle.
You might also label this as better-for-you (BFY) versus mainstream, but naming branches is one of the toughest parts of CDT work. (I’ve seen more than one meeting derailed by a heated debate over whether “Premium” or “Health-Oriented” was more accurate!) Because not all brands here are purely BFY, I’m calling this first branch Premium to capture both quality and perception.Within Premium — Two Key Breaks:
Dietary Needs: Here we see shoppers pursuing Gluten-Free or High-Protein mixes. These shoppers tend to be extremely loyal—once they find a product that fits their dietary needs, they rarely switch.
Premium / Organic: The next layer captures brands that lean into organic ingredients, sustainability, or premium branding. While not all fall neatly into “better-for-you,” there’s definitely a health halo here.
Mainstream vs. Value:
Once shoppers move past the premium options, they typically face a choice between mainstream national brands and value offerings.Value: This branch includes bulk packaging (better price per ounce for families or frequent users) and private label/value brands.
Mainstream: Here’s where the fun really begins. There are numerous sub-decisions—flavor variety, package size, and format. Some shoppers opt for multi-packs to cover multiple breakfasts, while others choose single-use or Shake-n-Pour containers for convenience and minimal cleanup.

What Do You Think?
If you’ve ever stood in the breakfast aisle longer than you expected, now you know why. Even something as simple as pancakes comes with a small maze of micro-decisions—health vs. indulgence, price vs. convenience, tradition vs. innovation.
Were you surprised by the dominance of dietary needs in the premium space? Or by how packaging plays almost as big a role as flavor?
These insights highlight why CDTs are so powerful: they translate scattered purchase data into structured, human-centered logic. You can almost see the shopper thinking, “Protein sounds good… but is it worth the extra $1.50?”
What’s Next
Now that we’ve flipped both sides of the breakfast experience—pancakes and syrups—it’s time to put them together. In the next installment, we’ll explore how these categories interact. Normally, I’d build a Category Landscape to visualize how decisions across different categories cluster together. However, this case calls for a twist—I’ll experiment with a different approach to see where the overlaps (and gaps) appear, and what opportunities might exist for brands or retailers to bundle, cross-promote, or innovate.
Stay tuned—because this next one’s going to bring the whole breakfast table together.
💬 Your Turn
Does any of this surprise you?
Do you see different patterns in your own data or stores?
I’d love to hear from category managers, brand teams, or fellow data nerds — what would you expect to see in a pancake CDT?


Contact
Contact me for questions, comments, suggestions or anything else!
info@eurekadatalab.com
© 2025. All rights reserved.